
Hi, I'm Nathan Selikoff, a cross-disciplinary senior engineer!
I'd love to join the Observable Engineering team :)
Links
My Values
-
Empathy: I deeply care about people and believe that it’s critical to value all stakeholders in a company: employees, customers, owners, investors, the general public, and the earth itself.
-
Quality: I’m extremely detail oriented and care about doing things the right way and leaving them better than when I started, balanced with pragmatism and an iterative philosophy of software and product development.
-
Creativity: My background in tech, art and design helps me see the world a little bit differently and invite others to do the same.
About Me
Why do you want to work at Observable?
I come from an interdisciplinary art + tech background and have had quite a nontraditional career. My mom is an artist and my dad is a software engineer so I’ve grown up around both influences, which has benefited me greatly. I’ve never worked in a traditional tech company, having spent most of my 20+ year career freelancing with a variety of small businesses, non-profits, and later advertising and design firms.
Three years ago, I started a remote-first social enterprise called Omnimodal to address the need for high-quality, real-time data for public transit and other mobility systems. My cofounder and I talked a lot about fostering an inclusive, equitable and accessible environment where we and future team members could be ourselves, be honest with our needs, and look after our other passions and desires outside work. People describe me as kind, gentle, patient, and a good listener.
I’m now moving away from day to day responsibilities at my startup, and am seeking the right team for the next stage of my career. I have been extremely impressed with the Observable platform, and the ways it streamlines experimentation and collaboration and embraces the “notebook” paradigm. I also appreciate the team’s work on other tools and resources like d3, TopoJSON, and the “Command-Line Cartography” series, all of which I have had the pleasure of using in various projects. I love the emphasis on open source but am also happy to see the development of a sustainable business model through Observable that will hopefully support this kind of work for years to come.
With 12 years of JavaScript experience, 15+ years building the web, and 20+ years bringing interactive experiences to life, I believe I would be a great addition to the Observable team. I love prototyping new ideas quickly; designing and building intuitive data visualizations, maps, interactive experiences, and web applications; and aligning my daily work with a mission as important as yours: empowering people to explore data and think with code.
There’s a lot more I’d love to share, but I’ll leave you with one final tidbit: my wife and I rode bicycles 1000 miles across the US in the summer of 2009!
Projects and previous work
Fork My Transit Data Viz

Context
In January 2019, I presented at the Transportation Research Board annual conference on work that my startup had done with a friend to visualize the impact of implementing “bus rapid transit” (BRT) service. A key part of the presentation for the innovation challenge was this Observable notebook. I was responsible for creating the notebook and implementing the map and visualizations, and we were runners up in the competition. Afterwards, I gave a less formal (more fun) presentation at an “unconference” called Transportation Camp, where I introduced the group to Observable and invited them to fork my transit data viz.
Links
- Observable notebook
- Slides and additional links that I shared with attendees
Mobilize
Context
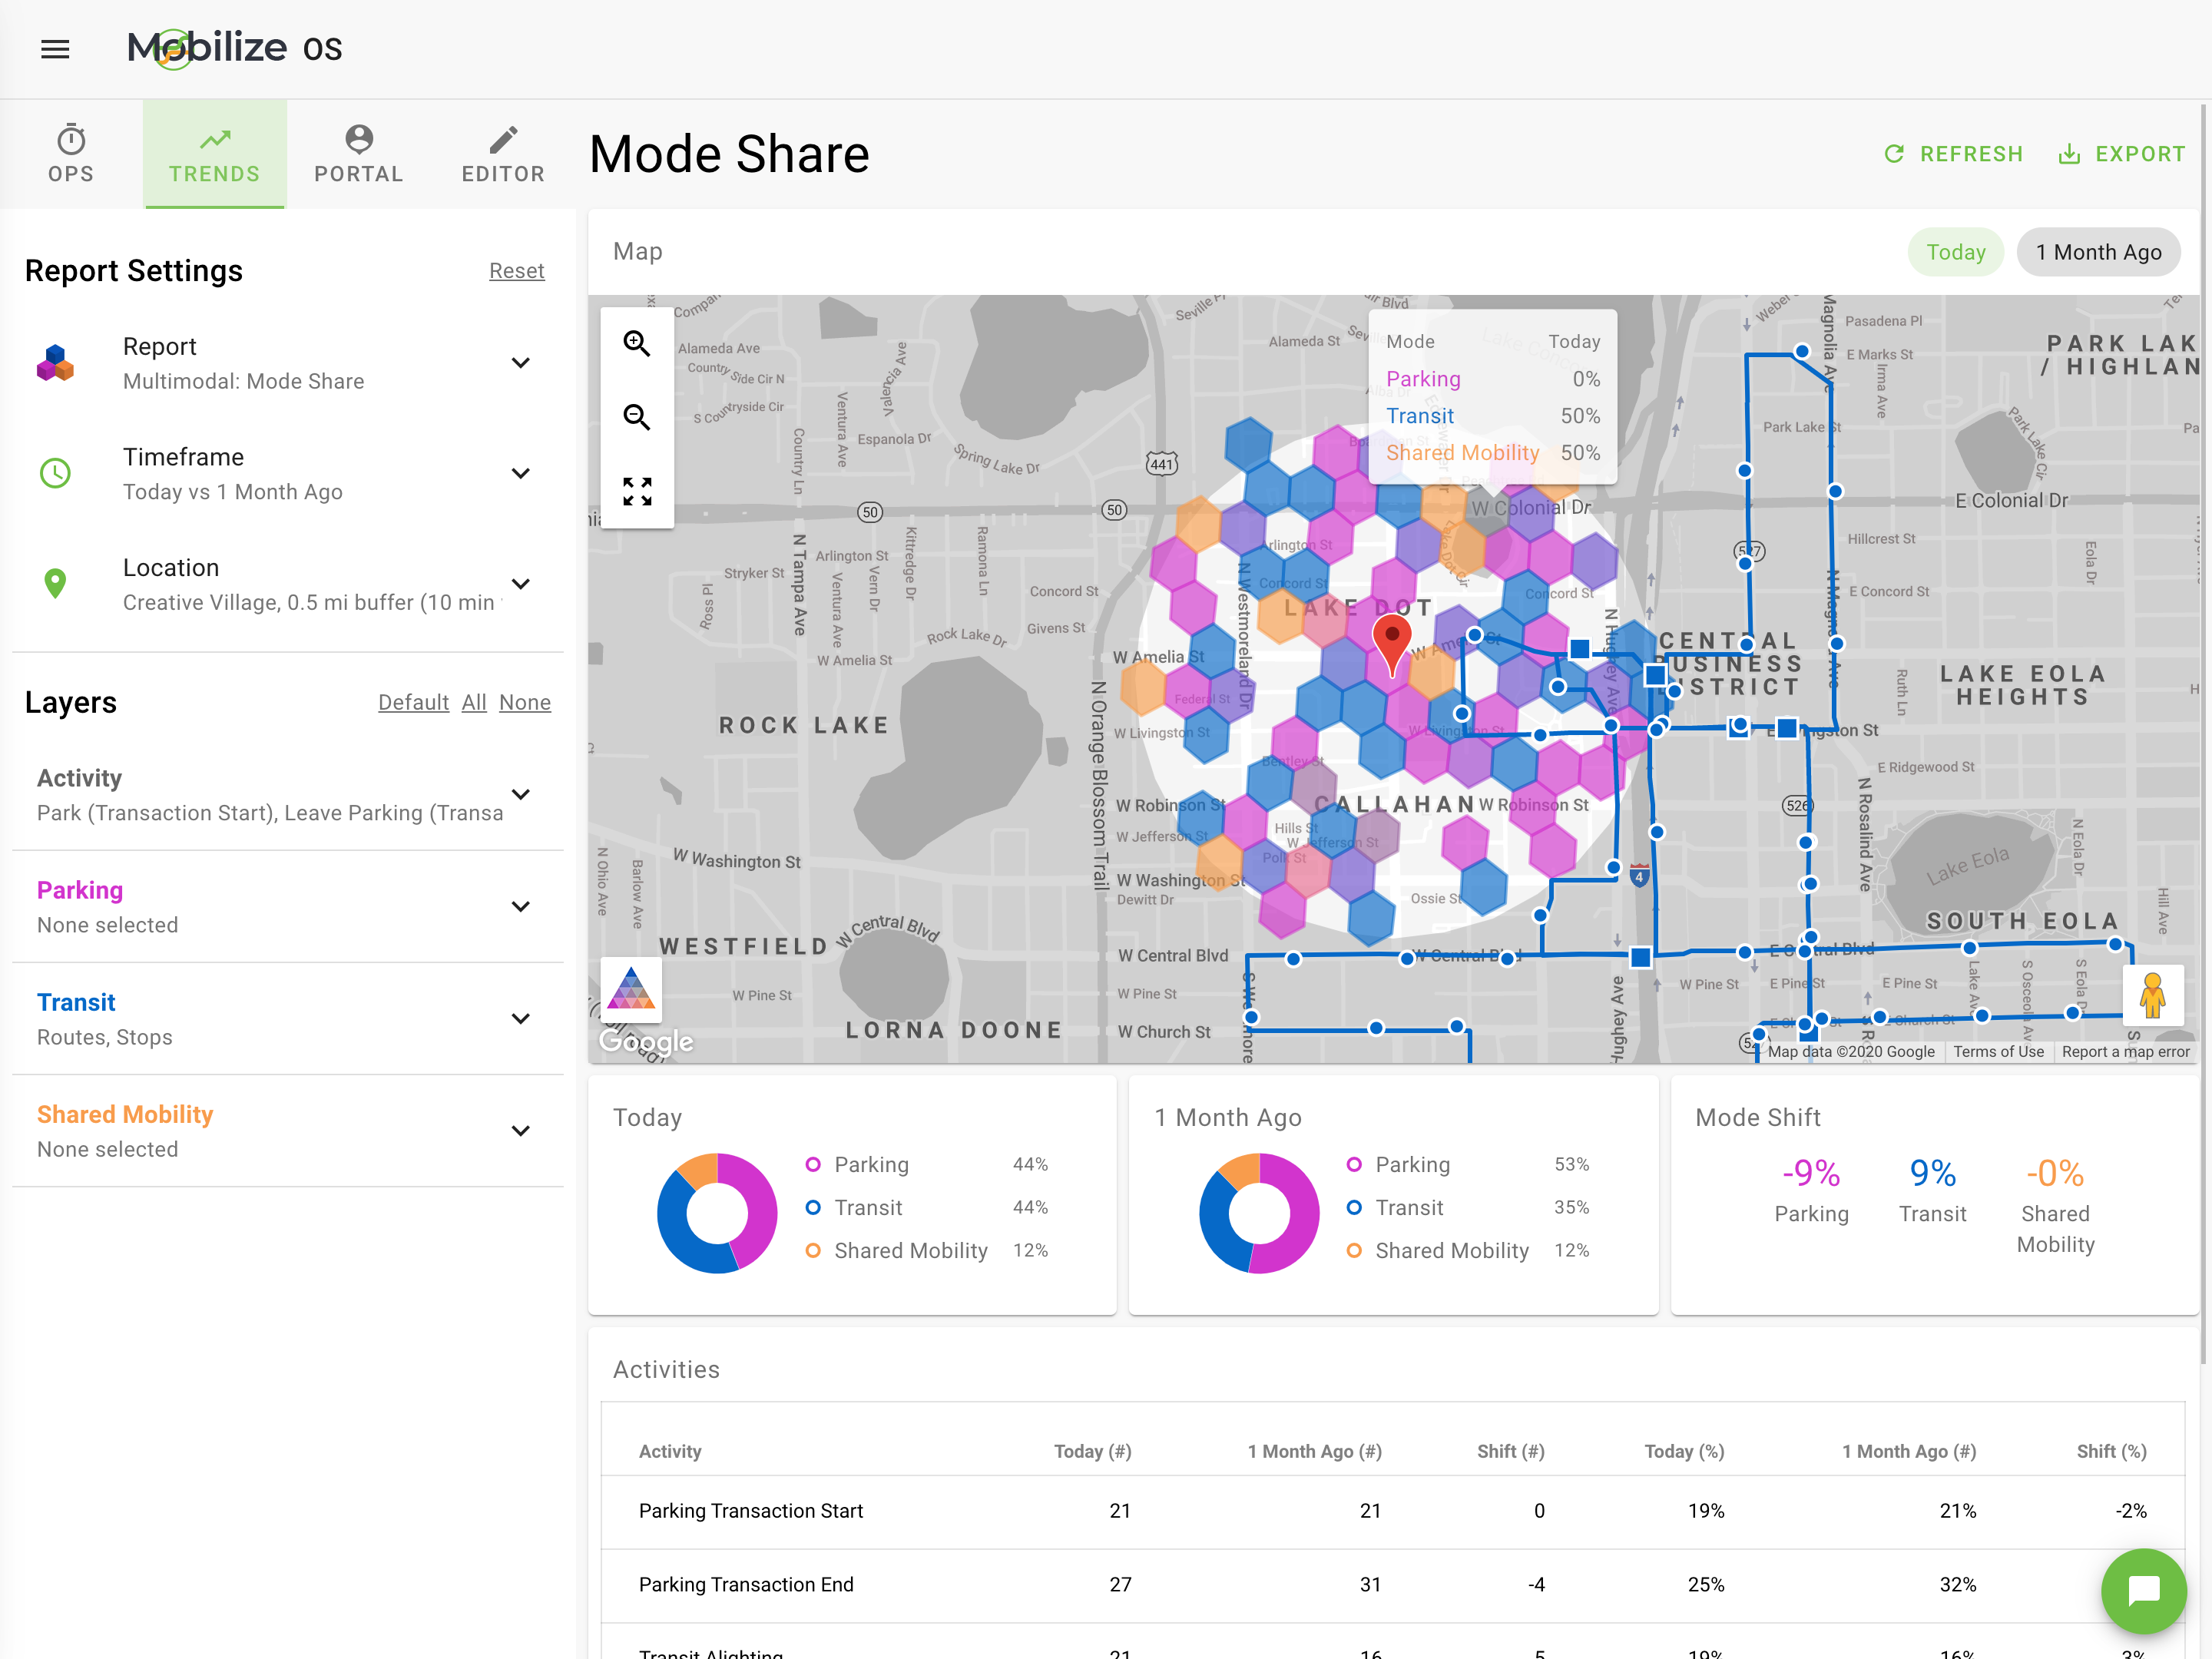
In the past three years, as CTO and co-founder of a startup, I’ve been designing and building a real-time geospatial data platform from the ground up.
To accomplish this, I’ve utilized and experimented with geospatial visualization APIs (Google Maps, Mapbox, turf.js, d3.js), pub/sub services (PubNub), streaming event pipelines (AWS Kinesis, Lambda), microservices (node.js), caching layers (Redis, AWS CloudFront), and more traditional web app frontends (Ember.js) and backends (Ruby on Rails, PostgreSQL). I’ve also dockerized legacy Java applications to facilitate deployment on AWS ECS/EC2, for particular needs in the data pipeline.
Part of the challenge has been to engineer reliable and scalable cloud-based data pipelines that can fetch and archive mobility data from public transit, shared mobility (bicycles and scooters), and parking APIs - and transform, cache, and make the data available to an intuitive web-based analytics dashboard.
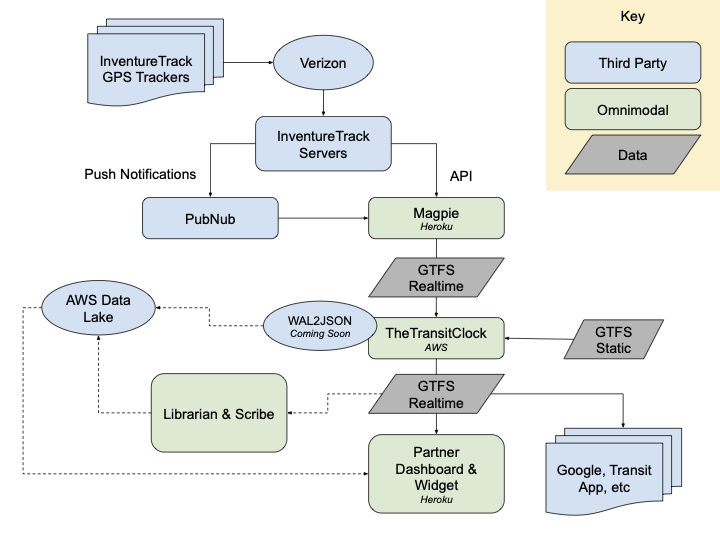
Some of the third-party APIs we integrate with are based on open data standards (yay!) and some of them are not. Some endpoints are reliable; many are not. We know some of the ways that we want to use the data now, but there will be future uses that we haven’t foreseen. To address these challenges, I designed and built a node.js microservice called scribe, and a Ruby on Rails + Sidekiq + Redis module called librarian.
Originally its own app, the Librarian registers real-time and static data feeds in a database, with metadata that describes where to fetch them from, how often to fetch them, and the last time they were fetched and archived. When the Librarian is run, a clock process will ping all registered feeds according to their configuration attributes, and when the time is right, will ask the Scribe to fetch and archive the feed in raw form into AWS S3, by POSTing with the appropriate info. If successful, the Scribe will respond with 201 Created and various metadata.
This system is in production with 14 data feeds for the City of Orlando, but is designed to be able to scale up to hundreds of cities and thousands of data feeds.
Links
The code is not open source, but I’ve extracted the READMEs for a little more context and would be happy to walk you through the system in further detail.
Filaments

Context
In 2014, I spent 6 days with about 200 students at Stone Middle School in Melbourne, Florida, teaching them the basics of making art with code. On the first day, I introduced the concept of “computational creation,” or “creative coding,” to the students, along with a discussion about using a sketchbook / design notebook in the creative process. Following that, we spend a few days with both Scratch and Processing, two programming environments accessible to students.
With Processing, we focused on abstract, algorithmic art and code based on drawing simple shapes. We discussed drawing within a coordinate system, how color works on a computer versus with paint (additive vs subtractive), the draw loop, variables, and basic interactivity. I shared the “chaos game”, a stochastic method for generating a Sierpinski triangle, and talked about algorithmic drawing, giving them an example of mine called Filaments that many of them remixed.
Links
- Filaments on Glitch
- Filaments on Khan Academy (make sure to check out the remixes!)
- My original Filaments blog post
- Full writeup of my teaching artist residency