Category
Data Viz & Web
Agency
Client
Asia Society, Rhodium Group, Gist
Tech
d3.js, JavaScript, Angular, MongoDB, Node.js, GeoJSON, TopoJSON, QGIS, OpenStreetMap
Role
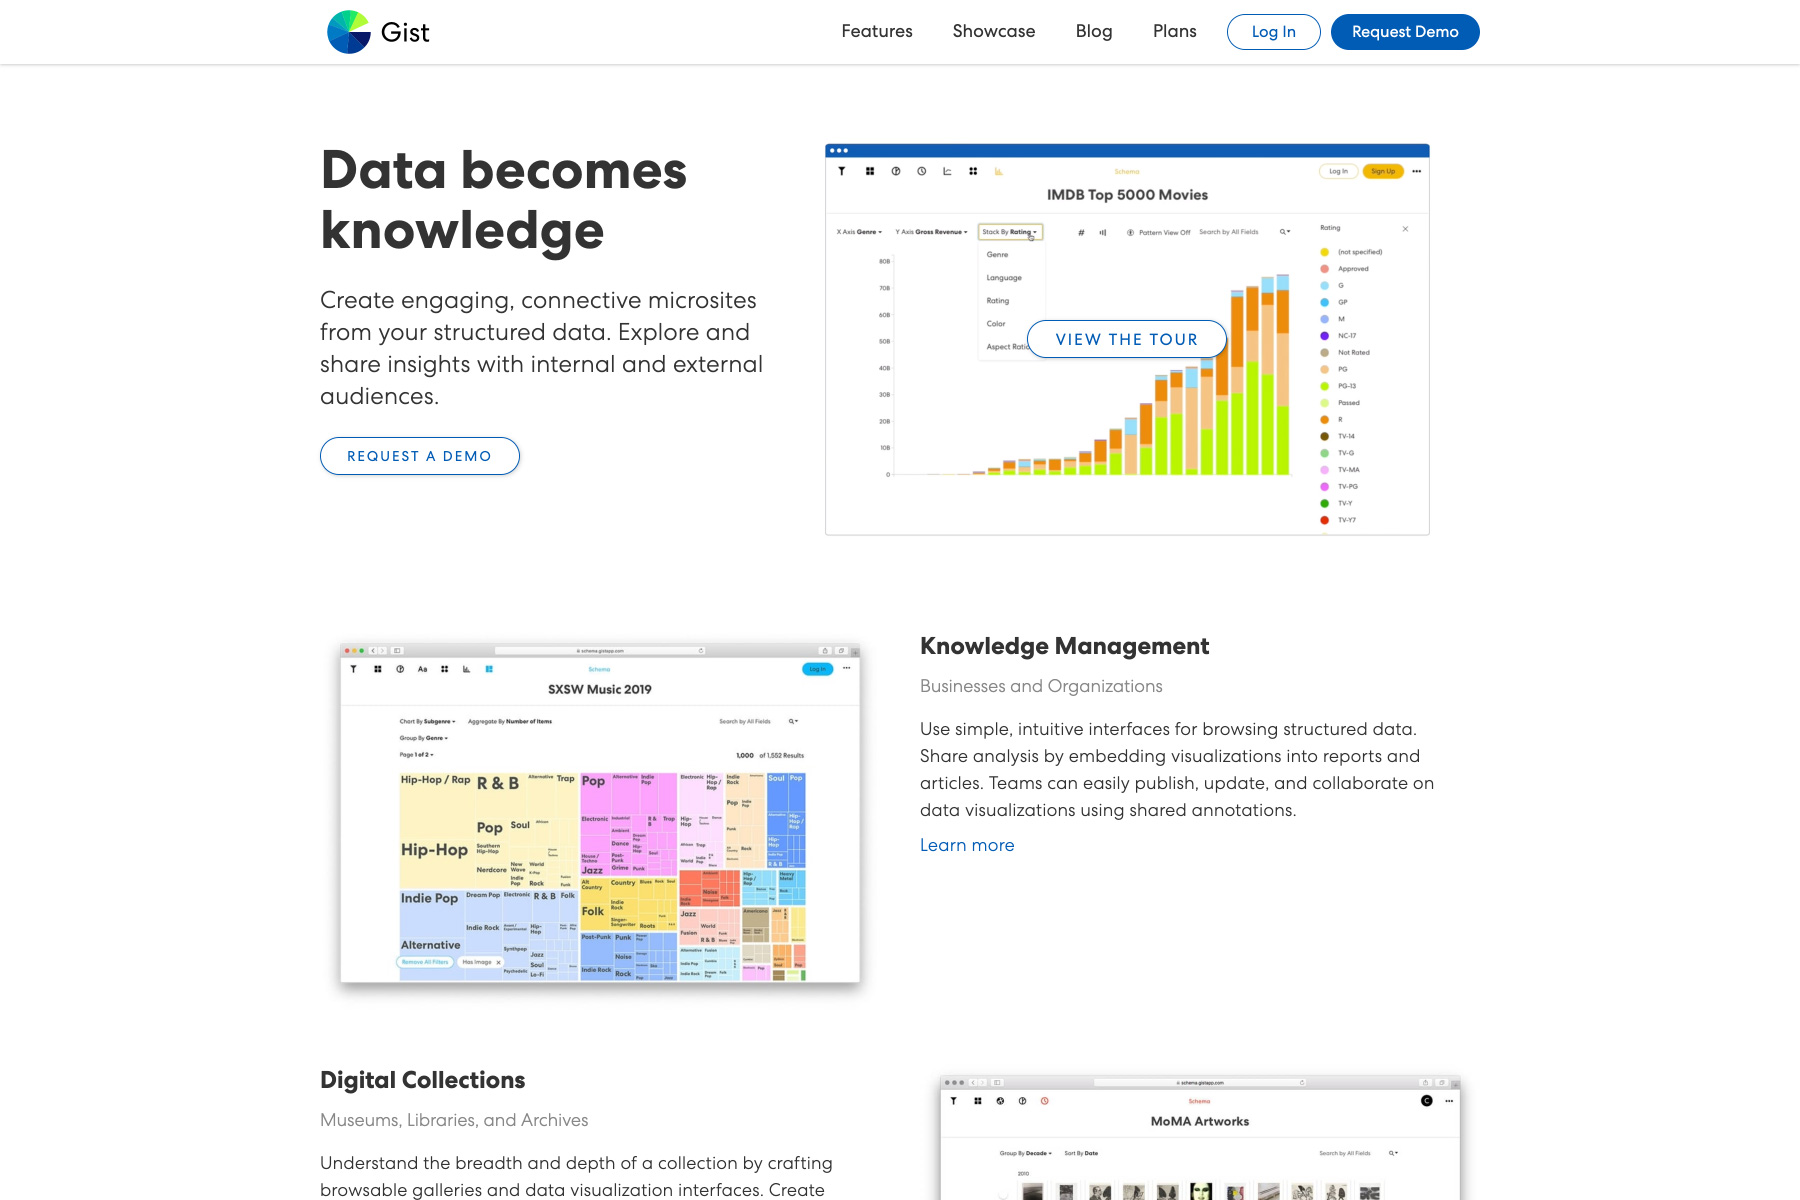
I joined the Schema team to help implement new features for their interactive data visualization platform, Gist.
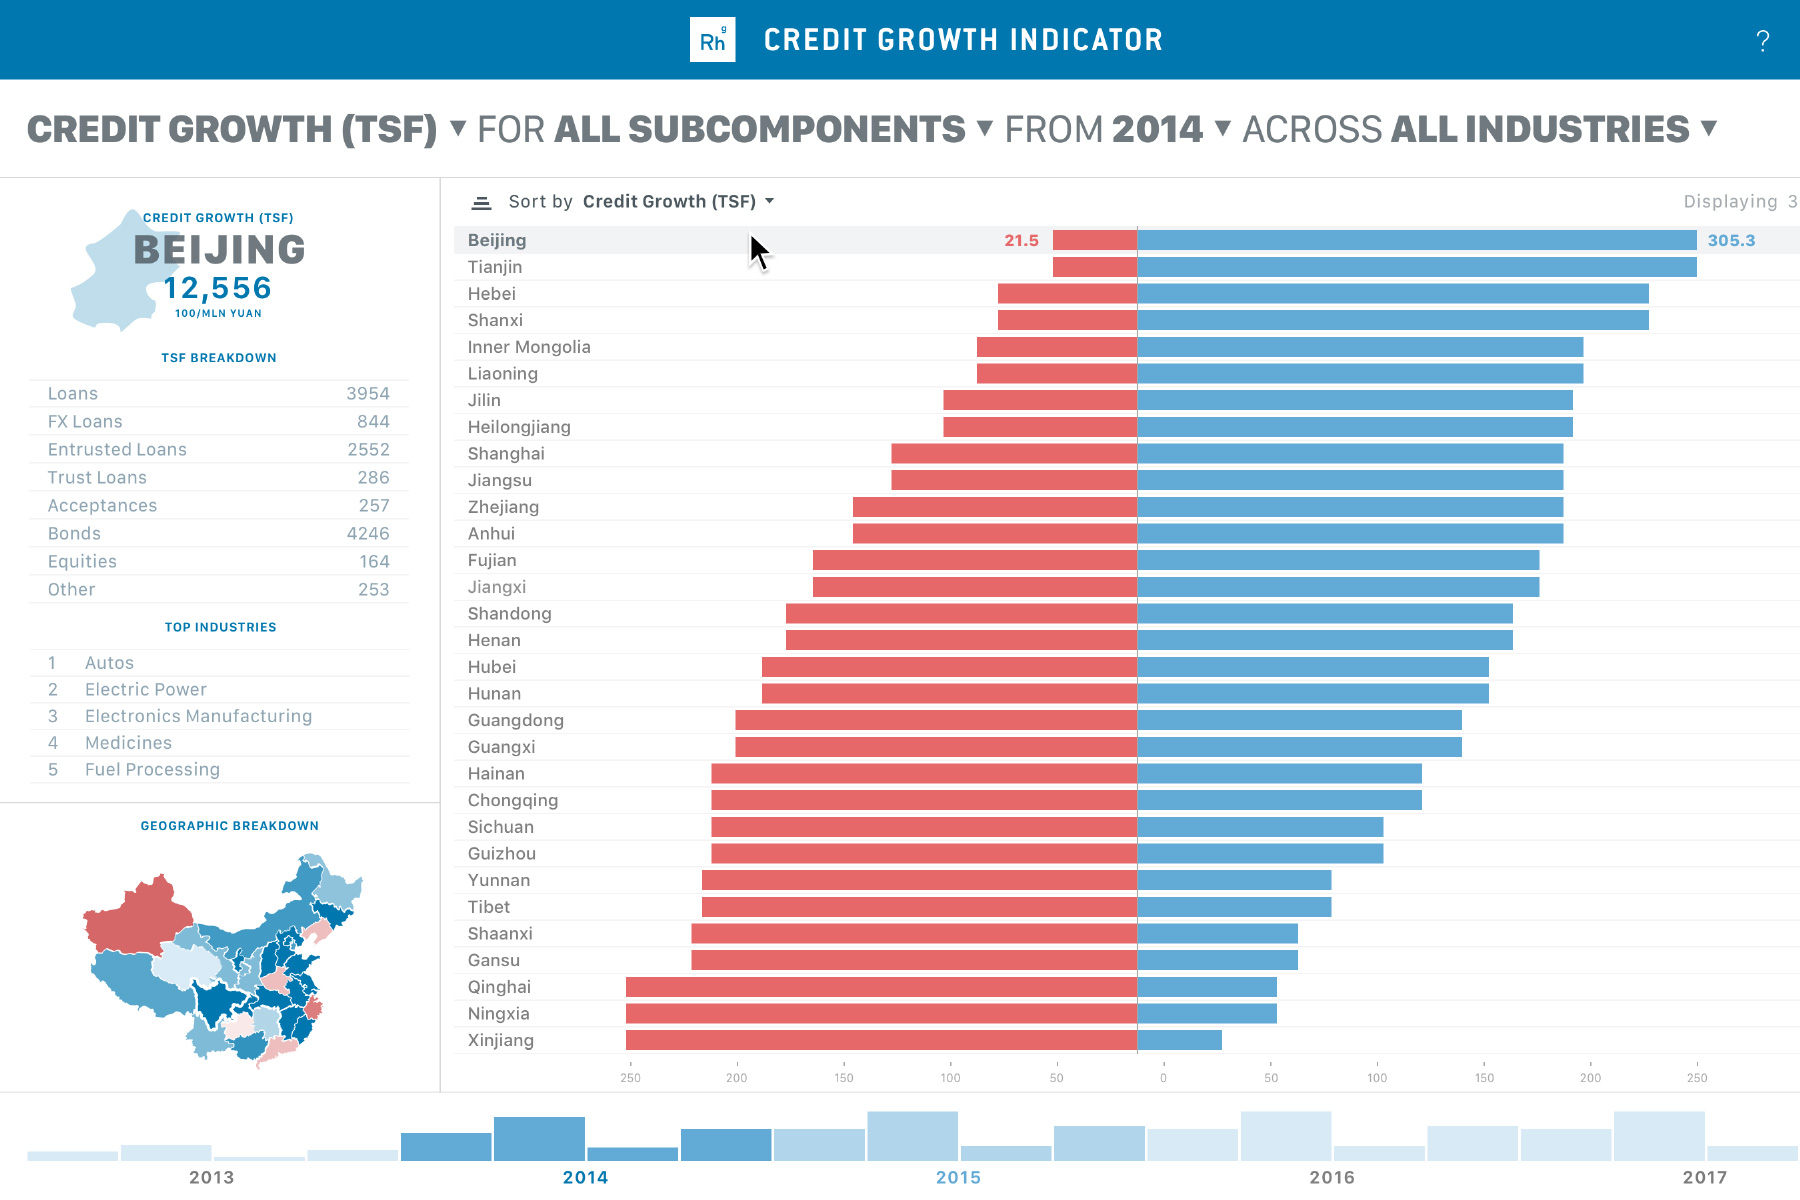
First, I implemented a standalone data visualization in d3 involving multiple interactive chart types and dynamic filtering.
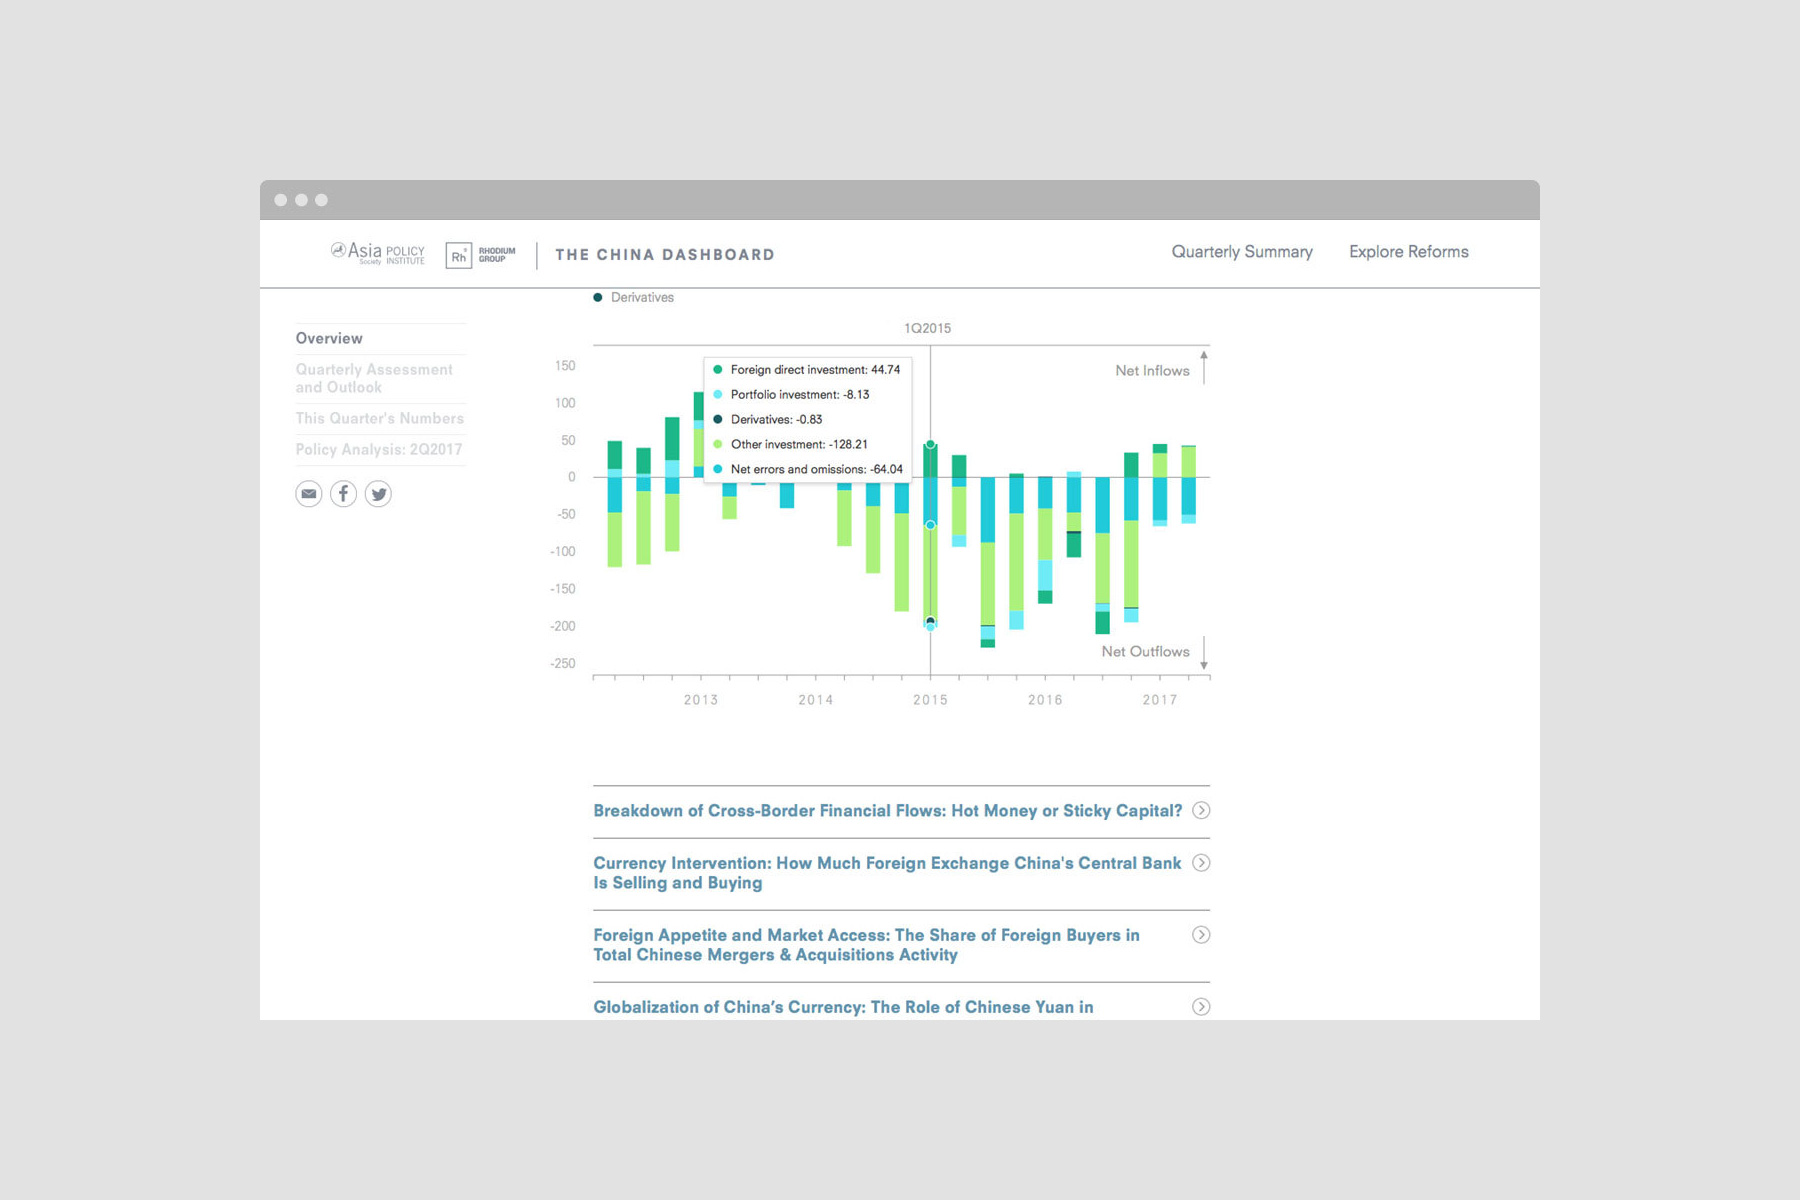
Second, we built out the embedding capabilities of the platform to support a CMS-like experience for The China Dashboard project’s data-driven pages.
Finally, I researched and developed a geo-data processing pipeline to support adding new regions of the world with administrative boundaries for choropleth maps to Gist.
Images and videos courtesy Schema Design.